Solutions · Program management
Design, run, and pay one program.
The program designed is the program that runs.
| # | Rep | Progress | Earned |
|---|---|---|---|
| Metro East | 1,067 / 1,35079% | $1,634.25 | |
| 1 |  Jack Repson Jack Repson | 460 / 50092% | $684.00 |
| 2 |  Amanda Jones Amanda Jones | 351 / 45078% | $512.25 |
| 3 |  Mitchell Chrysler Mitchell Chrysler | 256 / 40064% | $438.00 |
| North Valley | 396 / 1,05038% | $756.25 | |
| 4 | MAMarisol Alvarez | 176 / 40044% | $301.75 |
| 5 | DODele Okafor | 133 / 35038% | $256.00 |
| 6 | RSRahul Singh | 87 / 30029% | $198.50 |
Configuration
The designer sets it up.
A five-step setup covers settings, products, representatives, division goals, and payouts. The brand manager who negotiated the deal builds the program directly, instead of writing rules on a sheet and handing them to a single specialist to key in.
- Program types, product groups, and per-SKU conditions in one flow.
- Per-rep, per-group, and per-division goals.
- Built by the designer, legible to everyone the program binds.
Real-time tracker
Everyone watches one live number.
The leaderboard shows program progress with a per-rep payout breakdown, updated as orders land. Leadership, managers, and reps read the same record, so the design and the reality can't quietly drift apart.
- One live leaderboard, shared across the org.
- Per-rep earned and qualified amounts, visible in place.
- Admin score overrides when a manual adjustment is warranted.
| Representative | Cedar Reserve | Ridgeline | Harbor Street | Total goal |
|---|---|---|---|---|
| Program goal | 84/180 | 60/144 | 28/72 | 172/39643% |
| Jack Repson | 24/30 | 18/24 | 9/12 | 51/6677% |
| Amanda Jones | 19/30 | 14/24 | 8/12 | 41/6662% |
| Mitchell Chrysler | 15/30 | 11/24 | 5/12 | 31/6647% |
 Patricia Edmindson Patricia Edmindson | 11/30 | 7/24 | 3/12 | 21/6632% |
| MAMarisol Alvarez | 9/30 | 6/24 | 2/12 | 17/6626% |
| DODele Okafor | 6/30 | 4/24 | 1/12 | 11/6617% |
Jack Repson · Cedar Reserve24/30 placedCedar Reserve CabernetON · Cedar & Vine6/6 unitsCedar Reserve RedON · The Tasting Room3/6 unitsAmanda Jones · Ridgeline14/24 placedRidgeline Pinot NoirOFF · Harbor Point Market6/6 unitsRidgeline SyrahON · Cedar & Vine3/6 unitsPayout engine
Payouts are computed, not reconciled.
The engine calculates earned and qualified amounts per rep across four payout structures, with tiers and partial completion handled. Month end stops being a manual reconciliation that erodes reps' trust when the pay comes out wrong or late.
- Four payout structures, tiers, and partial completion.
- Per-rep calculation, out of the tool, not a side spreadsheet.
- The number reps see is the number the engine computed.
| Representative | Goal progress | Payout |
|---|---|---|
| Jack Repson | 51/6677% | $1,800$2,000 |
| Amanda Jones | 41/6662% | $1,200$1,000 |
| Mitchell Chrysler | 31/6647% | $600$500 |
| Patricia Edmindson | 21/6632% | $250— |
| MAMarisol Alvarez | 17/6626% | $250— |
Opportunities
The program names the gaps.
Inside a program, an Opportunities view surfaces the account-by-product gaps a rep can act on, so field effort goes where it converts instead of guessing across the whole book.
- Account-by-product gaps, surfaced inside the program.
- The rep works a short list, not the full catalog.
- Hunting with data instead of fishing on instinct.
 476 opportunities
Potential revenue $176,120
476 opportunities
Potential revenue $176,120
| Product | Insight | Category | List price | |
|---|---|---|---|---|
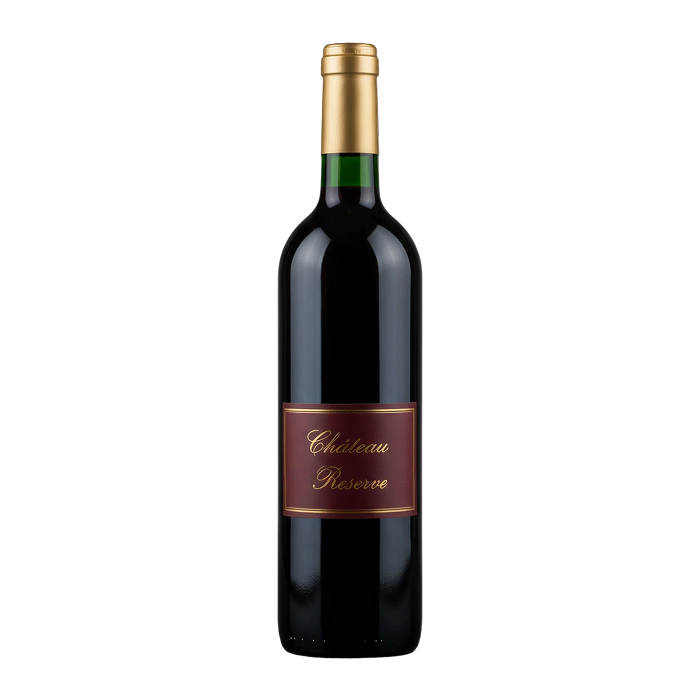 Cedar Reserve Red12/750 mL · (2021) Cedar Reserve Red12/750 mL · (2021) | Brand extension | Wine | $28.00 | |
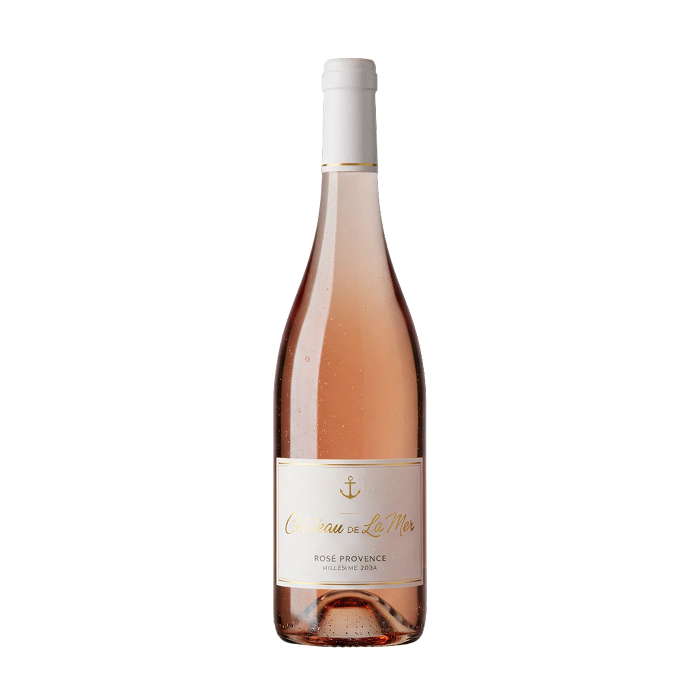 Marble Hill Rosé12/750 mL · (2023) Marble Hill Rosé12/750 mL · (2023) | Line extension | Wine | $17.50 | |
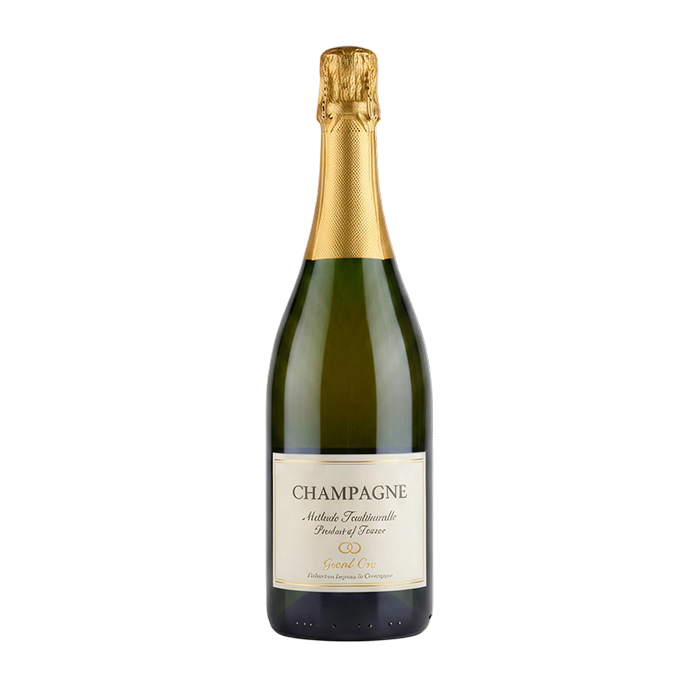 Cedar Brut6/750 mL · (NV) Cedar Brut6/750 mL · (NV) | Brand extension | Sparkling | $34.00 | |
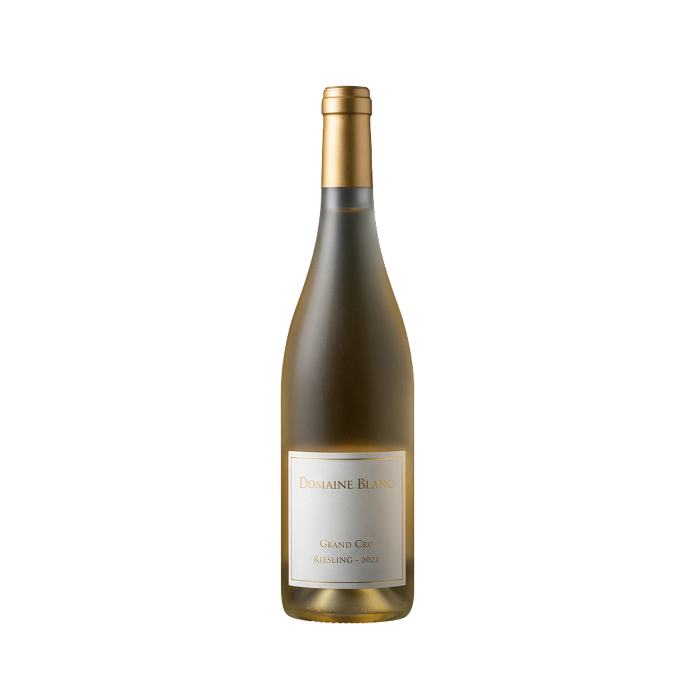 Ridgeline Chenin Blanc12/750 mL · (2022) Ridgeline Chenin Blanc12/750 mL · (2022) | Unsold account | Wine | $19.00 | |
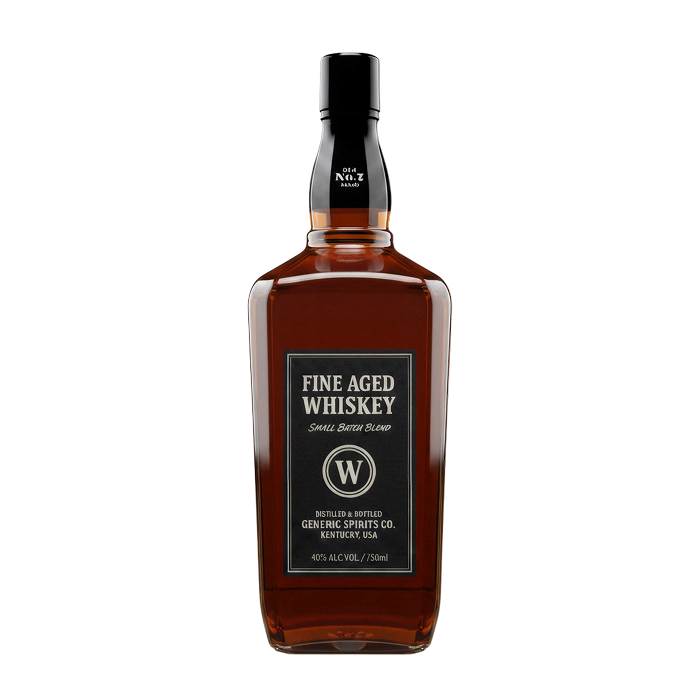 Harbor Street Rye6/750 mL Harbor Street Rye6/750 mL | Line extension | Spirits | $41.00 | |
| Corvina Ridge Ripasso6/750 mL · (2020) | Unsold account | Wine | $26.00 |
Exceptions
Adjustments reverse their own credit.
When a credit needs to be pulled back, the exception handles it automatically, so a corrected order doesn't leave a rep credited for volume that didn't hold.
- Adjustments recorded against the program.
- Automatic credit reversal on the exception.
- The leaderboard stays honest without manual cleanup.
| Original credit | Order #ORD-4821 | +48 cases |
| Reason | Order corrected — 48 cases returned | |
| Automatic reversal | Credit reversed | −48 cases |
| Net to program | R. Singh | 0 cases |
Roll-up and year-over-year
Scores roll up the division tree.
Program scores roll up the division hierarchy for reporting, and year-over-year baselines let this year's goals cascade from last year's performance.
- Division roll-up for reporting up the org.
- Year-over-year baselines for goal cascades.
- One record from a rep's order to the division total.
| Division | This year | YoY baseline |
|---|---|---|
| West | 1,842 | 1,610 |
| Central | 1,455 | 1,388 |
| East | 1,203 | 1,271 |
Total 4,500 cases · rolled up the division tree | ||